

One in four (29.4%) Australian children between the ages of 5 and 17 years are overweight or obese and more than seven in ten (73.0%) are not meeting the guidelines of fruit and vegetable intake (Australian Bureau of Statistics, 2018). Twenty percent of 4–8-year-old males and 25% of 4-8 year old females are overweight or obese (Australian Institute of Health and Welfare, 2018). It has been shown that obese children are more likely to suffer from bullying, reduced exercise ability, gastrointestinal problems, orthopaedic complications and sleep apnoea. These children are also more likely to become obese adults and develop non-communicable diseases (Serdula et al, 1993; World Health Organization, 2020).
Diet plays an important part in children's academic performance (Florence et al, 2008). Studies show that undernourished children have decreased attention spans and poorer academic performance (Taras, 2005). Recent studies show that eating breakfast has a positive effect on school-aged children's cognition as well as academic performance and behaviour (Mathews, 1998; Kleinman et al, 2002; Taras, 2005). A survey on dietary intake, height, weight and sociodemographic status conducted with grade 5 children in Nova Scotia, Canada, demonstrated that diet variety and adequacy were important in the academic performance of these children (Florence et al, 2008). Particularly important was an adequate dietary intake of fruits, vegetables and fat (Nicklas et al, 2004).
Gonzalez-Suarez et al (2009) conducted a meta-analysis on school-based interventions and found that these were effective in reducing the prevalence of obesity in young children in the short term, with longer-running programmes even more effective. A Brazilian study (Matuk et al, 2011) reported that lunchboxes of second to fifth grade children at a private school contained highly processed foods consisting of sugar, fat and sodium and little fruit and vegetables. To address such issues, Tilley et al (2014) conducted an intervention at school level involving teaching staff, parents and children on how to build a better lunchbox. This study had positive outcomes resulting in an average increase of approximately 12% for fresh fruit, 11% for vegetables, 14% for water. Additionally, there was a decrease in low-nutrient-dense foods, including a 15% decrease in chips and a 13% decrease in non-100% fruit juice. A further outcome of this study related to staff, with an increase of 17% in fruit and 13% in vegetable intake, as well as a decrease of 6.4% in their soft drinks and 30.5% in chips consumption.
There are mixed findings in relation to when children obtain nutritional knowledge and the longevity of health behaviours. A cluster RCT study conducted in South Africa by de Villiers et al (2016) showed that increasing nutritional knowledge and self-efficacy in primary school children did not improve eating behaviour. However, content and quality of consumption do not improve with older primary school children, thus intervening at a younger age may be a preferred strategy in order to improve eating habits with age (Stevens and Nelson, 2011; Huang et al, 2017). Intervening at school in the early years of primary education may have more effective outcomes than later in schooling life when unhealthy habits may have already been formed. According to the Australian Guide to Healthy Eating (AGHE) from the Australian Dietary Guidelines (ADG), the quantity of serves recommended from the different food groups varies according to gender and age (National Health and Medical Research Council, 2015). It is recommended that children in the age group of 4–8 years avoid discretionary foods or limit them to 1 serve per day (such as 2 scoops of regular ice cream or 2–3 sweet biscuits) unless they are taller or more active than the average child. The aim of this review was to systematically examine the literature on the nutritional content and quality of meals consumed by primary school children (aged 5–8 years) during recess and lunchtime. These findings may be used to inform future research designed to improve the dietary intake of 5–8-year-old children in the school setting, with the ultimate aim of reducing negative health impacts resulting from non-communicable disease.
Methods
Literature search
This review was registered with PROSPERO, the international register of systematic reviews, prior to commencement of the research, registration number CRD42019130472 and followed the Preferred Reporting Items for Systematic Reviews and Meta-Analyses (PRISMA) guidelines for systematic reviews. This review focused on younger primary (elementary) school children (5–8-year-olds) and compares children's school lunch food types and nutritional content to the guidelines set out by the country in which the study occurred. A systematic search strategy was conducted in four databases, Scopus, Medline, ProQuest and Cinahl. The search was limited to peer reviewed journal articles written in English, with studies including children aged 5–8 years and ‘school lunches’. The results were imported into Endnote X9 Clavarite Analytics 2019. The search was conducted by two researchers independently using the same strategies and the following search terms: primary school, grade school, elementary school, school aged, grade 0, grade zero, grade R, grade 1, grade one, grade 2, grade two, first class, second class, third class, infants' school, lunch*, pack*, recess*, canteen*, food, meal, snack, nutr* and diet*.
The literature searched was initially selected on title and abstract and those found suitable were then assessed on full text. Additional papers were handsourced from papers included in the initial search. There was no restriction placed on the date of the studies published. Duplicates were removed in Endnote X9 and the remaining articles were screened on full text. Those that did not meet the criteria of age and daily food and drink consumption at school were then excluded. Studies that did not differentiate between ages were also excluded from the review. Studies reporting on intervention outcomes where the consumption of food and nutrient type showed an increase or decrease but no mention of initial consumption quantities were also excluded from the study. Discrepancies were resolved by discussion between the two authors and those which could not be resolved were discussed with a third person (AM) where a consensus was reached.
Inclusion/exclusion criteria
Criteria for inclusion of articles in the review were as follows:
- The study was on children between the ages of 5 and 8 years
- The study was written in English
- The meal was packed and sent with the children to school, purchased from the canteen or supplied by the school cafeteria
- Articles included the nutritional quality and content of food with comparison to guidelines
- Only full articles were included
- No limitations were placed on settings
- Only quantitative designs were included
- No limitation was placed on the date of publication.
Data extraction
Data was extracted from the selected articles by KS and tabulated in a summarised table under the following headings: reference, study type, population, aim, duration, results, data collection method, level of evidence, setting and lunch type. Two authors reviewed the tables.
Assessment of quality and risk of bias
The risk of bias (ROB) was independently assessed using the Effective Public Health Practice Project Quality Assessment Tool for Quantitative Studies (EPHPP) (Effective Public Health Practice Project, 1998). This tool was chosen for its ability to assess various quantitative study designs relating to public health topics (Mills et al, 2013; Ward et al, 2016; Oostenbach et al, 2019). Risk of bias was assessed for six components: (i) selection bias; (ii) study design; (iii) confounders; (iv) blinding; (v) data collection methods; and (vi) withdrawals and drop-outs. Each of these six components was rated on a three-point scale as strong, moderate or weak leading to an overall methodological rating score of strong (no weak ratings), moderate (one weak rating) or weak (two or more weak ratings). Two reviewers independently assessed the quality of the studies and rated them from level one to level four and risk of bias by rating them as having a strong, moderate or weak risk of bias.
Results
The initial data extraction process resulted in 796 articles. Of these, 583 appeared in Scopus, 106 in ProQuest, 38 in Cinahl and 69 in Medline. Once duplicates were removed, 690 articles remained. The titles and abstracts were screened for relevance which resulted in 49 articles. The full text of the remaining documents was reviewed, which resulted in the final 9 peer-reviewed articles that met the inclusion criteria for this SLR. This is detailed in the PRISMA flow diagram (Figure 1). The nine studies included in the SLR were published between 2007 and 2020, consisting of one randomised control trial (Evans CEL et al, 2010), seven cross-sectional studies (Evans CE et al, 2010; Stevens and Nelson, 2011; Evans et al, 2016; Evans and Cade, 2017; Huang et al, 2017; Ibeanu et al, 2017; Evans et al, 2020) and one longitudinal study (Rogers et al, 2007) which was conducted over a 10 year period. It should be noted that five of the identified articles were conducted by Evans et al which included 4 cross-sectional studies and one RCT. The study sample sizes varied between 311 and 2709 children. A summary of the included studies can be found in Table 1.
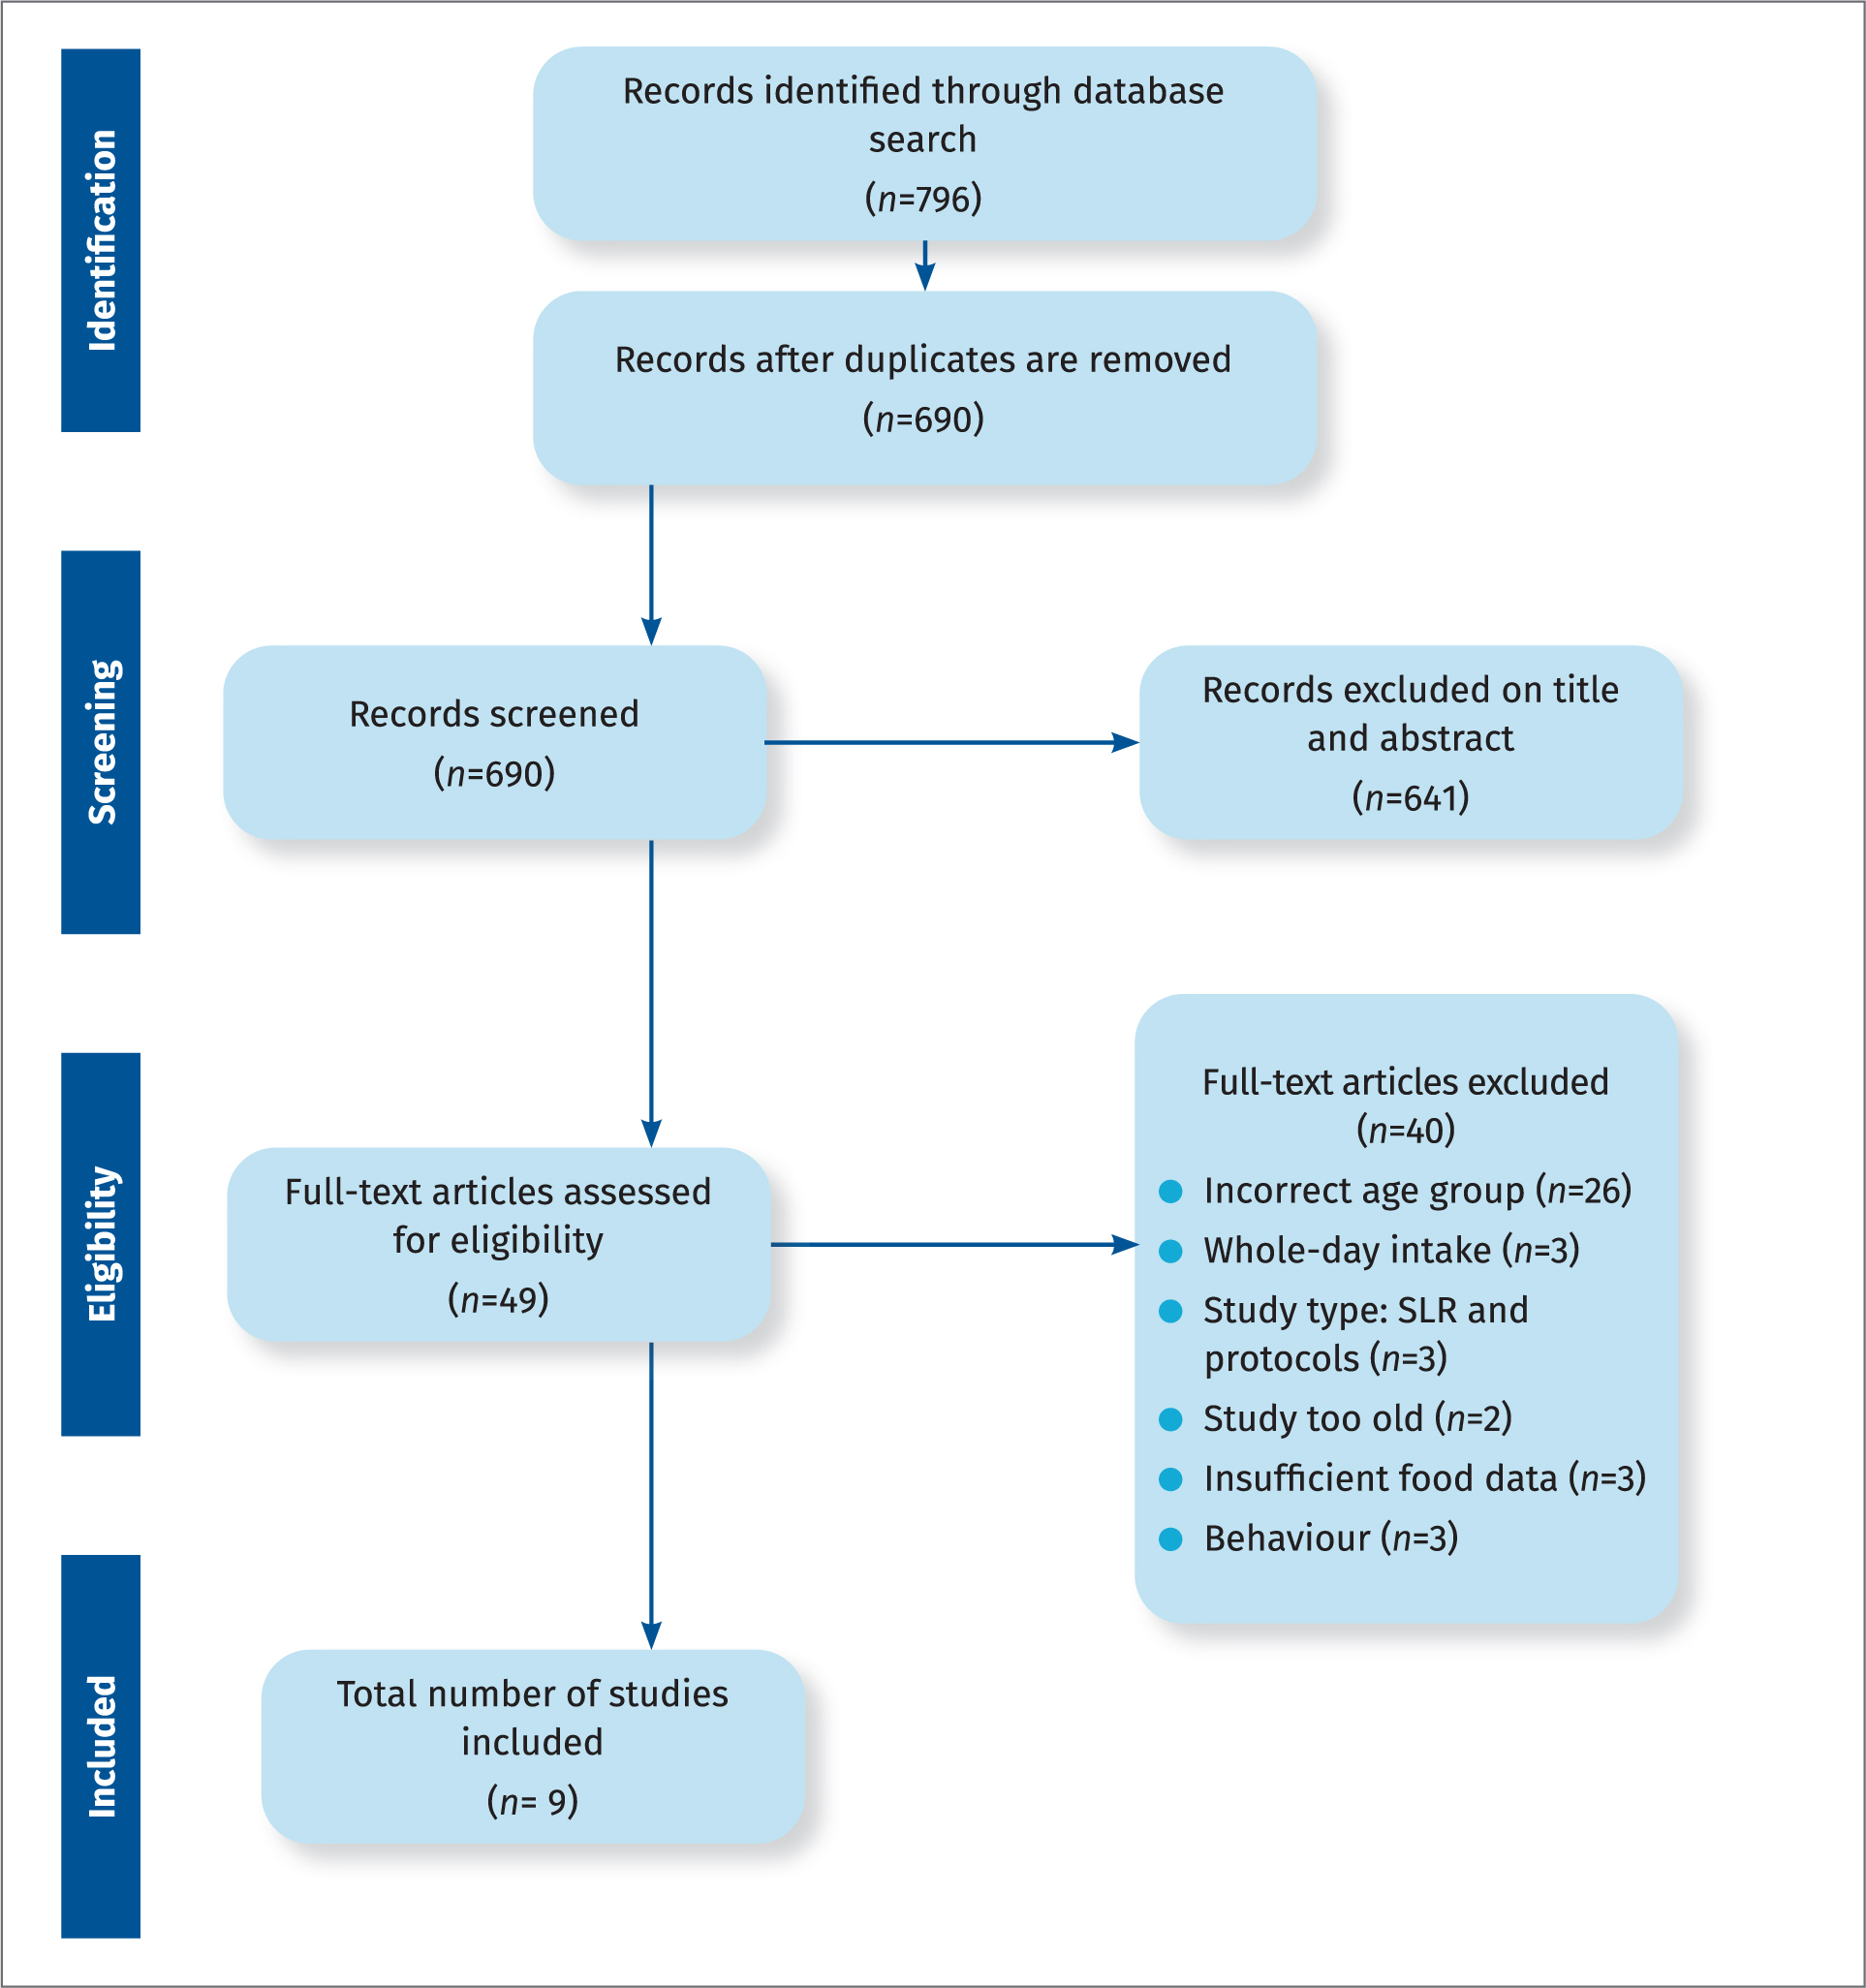 Figure 1. PRISMA flow chart of search strategy results
Table 1. Overview of each study included in the review
| Article | Study type | Population | Aim | Duration | Data collection method | Setting | Lunch type |
|---|---|---|---|---|---|---|---|
| Evans CE et al (2010) | Cross-sectional study | 1294 children 8-9yo (663 male, 631 female) | The aim of this study was to identify food and nutrients provided in the packed lunch as well as what is consumed. The results compared with the food and nutrient standards for primary school meals introduced between 2006 and 2008 in England. | Not reported |
|
UK | Packed lunch |
| Evans CEL et al (2010) | Cluster randomised controlled trial – 12-month follow up | 1291 children from 89 primary schools, 8-9yo at baseline (54.9% male)971 children and 83 schools at follow up | The aim of the study is to conduct the first known cluster randomised controlled trial to improve the contents of packed lunches using an intervention named the ‘SMART’ lunch box, thereby bringing packed lunches more in line with school meals meeting current government standards. | 12 month follow up |
|
UK | Packed lunch |
| Evans et al (2016) | Cross-sectional survey | 2709 children 6 - 8 years (50% male), 54 primary schools | The aim of the present study was to determine nutritional and dietary differences by lunch type. | Not reported |
|
UK | Packed vs school prepared lunch |
| Evans et al (2017) | Cross-sectional study | 1294 children (631 male, 661 female, 2 no gender collected), 89 primary school randomly selected, 4 UK regions1 class of year 4 children randomly sampled from each primary school | The aim of this study was first, to analyse children's lunches brought from home to identify the most important nutrients that predict a good-quality packed lunch compared with recommended and restricted foods; and second, to suggest a method to measure lunch quality that can be used to assess lunches brought from home. | Not reported |
|
England | Packed lunch |
| Evans et al (2020) | Cross-sectional survey | 323 children 8–9 years old, 18 primary schools | The aim of survey was to assess whether diet and nutrient quality of children's packed lunches had improved from 2006 to 2016 due to frequency or portion size of specific food types. | 10 days | Weighed food before & waste recorded & split into school food-based stds & nutrient analysis. | England | Packed lunch |
| Huang et al (2017) | Cross-sectional survey | 5389 students – 3 primary schools (2396 students), 3 middle schools (1841 students) and 1 high school (612 students) | This study aimed to evaluate the intake of food and nutrients among primary, middle, and high schools students in Shanghai, and provide recommendations for possible amendments in new school lunch standards of Shanghai. | 3 days |
|
Shanghai | School prepared lunch |
| Ibeanu et al (2017) | Cross-section study | 200 pupils 5–8 years old (no gender) | This cross-sectional study evaluated the nutrient content and percentage of RDI met by pupils who consumed home-packed lunch | 3 days |
|
Nsukka – SE Nigeria | Packed lunch |
| Rogers et al (2007) | Longitudinal study | 621 x 7 years old (346 male, 275 female) | The aim of this study was to compare the food and nutrient intakes of primary school children eating school dinners and packed lunches. | 15 months |
|
South West England | Packed vs school prepared lunch |
| Stevens et al (2011) | Cross-sectional study | 311 children (4–7 years old and 8-11 years old) | This study examines low income UK population (4-7yo and 8-11yo), the food consumption and nutrient intake associated with school meal and packed lunches and extent to which they conform to the new nutrient based standards for primary schools. | 15 months |
|
UK | Packed vs school prepared lunch |
Seven studies were performed in the United Kingdom (UK) (Rogers et al, 2007; Evans CE et al, 2010; Evans CEL et al, 2010; Stevens and Nelson, 2011; Evans et al, 2016; Evans and Cade, 2017; Evans et al, 2020), one in Shanghai, China (Huang et al, 2017) and one in Nigeria (Ibeanu et al, 2017). Three studies in the UK examined packed lunches from home as well as food bought at the school canteen and meals prepared and eaten at the cafeteria (Rogers et al, 2007; Stevens and Nelson, 2011; Evans et al, 2016). Five studies examined the foods and nutrients of packed lunches from home (Evans CE et al, 2010; Evans CEL et al, 2010; Evans et al, 2016; Ibeanu et al, 2017; Evans et al, 2020), the study in Nigeria by Ibeanu et al was the only one where the students had only packed lunches. Some of the children brought money to school to buy lunch from hawkers and 2.1% of the children came to school with nothing. The study conducted in Shanghai, China by Huang et al investigated the food type and nutrient quality of meals prepared by the school for all children (children do not bring packed lunches to school).
In the studies conducted by Evans and colleagues, the lunches children consumed were assessed according to the UK School Food Trust meal standards (UK School Food Trust, 2007) which is for meals made at school. It included eight food standards incorporating five healthy and three restricted foods. The standards also reflected 13 recommended nutrients shown in Table 2 (Evans CE et al, 2010; Evans CEL et al, 2010; Evans and Cade, 2017; Evans et al, 2020). Four studies were conducted via this method and the number meeting the eight food standards ranged from 0.5% to 3.7% post-intervention (Evans CE et al, 2010; Evans CEL et al, 2010; Evans and Cade, 2017; Evans et al, 2020). On average, only four of the eight standards were met and six of the thirteen nutrients standards were met (Evans and Cade, 2017). Sixteen percent on average met the five healthy standards, 21% meeting the restricted food standards.
Table 2. Nutrient and food standards – UK School Food Trust
| Heathy Standards | Restricted Foods | Nutrients |
|---|---|---|
| Protein rich foods: cheese, meat, fish or legumes | Sweetened drinks | Total fat (g) |
| Low-fat carbohydrate foods: bread, rice or pasta | Confectionery: cakes & biscuits containing chocolate, chocolate, sugar confectionery, cereal bars | Saturated fat (g) |
| Dairy-rich foods: cheese, yoghurt | Savoury snacks | Carbohydrate (g) |
| Fruit | Non-milk extrinsic sugars (g) | |
| Vegetables | Protein (g) | |
| Fibre (g) | ||
| Ca (mg) | ||
| Fe (mg) | ||
| Zn (mg) | ||
| Folate (mg) | ||
| Vitamin A (mg) | ||
| Vitamin C (mg) | ||
| Na (mg) |
The only study that mentioned the socioeconomic status (SES) of the participants was the Nigerian study by Ibeanu et al (2017). The children were from a high SES based on standards for low-income countries, but compared to global standards the levels could be considered low (Numbeo, 2009–2020). Of the nine studies, only five mentioned the gender proportion of the study (Rogers et al, 2007; Evans CE et al, 2010; Evans CEL et al, 2010; Evans et al, 2016; Evans and Cade, 2017).
Due to the fact that the outcomes were heterogeneous, a meta-analysis could not be conducted. Even though the studies showed heterogeneity, some common results such as lunch type, food groups and macronutrient and micronutrient quantities could be extracted from the data as shown in Table 3. The strength of the studies included in the review was assessed for ROB using the EPHPP tool. As eight of the nine studies were either cross-sectional or of longitudinal nature and were rated as being of weak quality and high ROB using the EPHPP tool, the strength of the results from the studies were deemed poor (Table 4).
Table 3. Analysis by lunch type
| Article | Meals – Packed lunches | Meals – School meals | Requirements met | Requirements not met |
|---|---|---|---|---|
| Evans CEL et al (2010) | Sandwiches, fruit, milk dessert, savoury snack, confectionery, SSB | Protein, carbohydrates & vitamin C most likely, 1.1% met all standards | Folate, vitamin A, Fe & ZnNa & fat in excess<50.0% meeting E from SFA | |
| Evans CEL et al (2010) | Sandwiches, fruit, milk dessert, savoury snack, confectionery, SSB | Approx 3.7% intervention and 0.6% control met all food standards. Protein, carbohydrates & vitamin C | E, Na & NMES | |
| Evans et al (2016) | Bread, spreads, ham, cheese spread, crisps, jam, yoghurts, chocolate biscuits, cake, cereal bars, dried fruit, sweetened drinks and fruit juice | Hot veg, pasta, stew, fish fingers, pizza, sausages, rice potatoes, gravy, custard & water | Fe | Starch, fibre & Zn lower Na & sugar higher |
| Evans et al (2017) | Sandwiches, fruit, milk dessert, savoury snack, confectionery, SSB | Approx 4/8 food standards & 6/13 nutrient standards met, 1.0% met all standards, 0.5% met none | Folate, vitamin C, FeNa too high | |
| Evans et al (2020) | Wraps, tortillas, sandwiches, SSB, confectionery, milk desserts, plain biscuits, flapjacks | 1.6% met 8 food standards16.0% met 5 healthy food standards21.0% met 3 restricted food standards>50.0% met protein, carbohydrates, total fat & Ca | SFA, NMES & NaFew meeting vitamin A, Fe, Zn & fibre | |
| Huang et al (2017) | Cooked lunch | Livestock, poultry, protein, fat, egg | Staple foods, seafood, beans, vegetables, carbohydrates, vitamin A, B1, B2, C, Fe, Zn & Ca | |
| Ibeanu et al (2017) | Jollof rice, spaghetti, groundnut pudding, milk, fruit juice, sorrel leaf drink & soft drinks Snacks - pastries, sandwiches & water | Protein, carbohydrates, niacin, vitamin B1, Zn & Fe | Ca, vitamin A & vitamin C | |
| Rogers et al (2007) | White bread, sugar preserve filling, fat spreads, crisps, sweet biscuits & fruit | Fried/roast potatoes, cooked veg, puddings & ice cream most popular. Buns, cakes, pastries, sausages, burgers, pies, pasta, rice, pizza, baked beans | Protein and vitamin C | Energy from carbohydrates, NSP, Ca, Fe, folate, Zn, Cu, Mg, I and riboflavin below guidelinesE from fat and SFA above recommended guidelines |
| Stevens et al (2011) | White bread, fats & oils, crisps & savoury snacks, sugar, preserves & confectionery | Pasta, rice, cereals & puddings, baked beans & potatoes | Protein, vitamin A & vitamin C – for all meals | Na, Zn and energy from fat, SFA, carbohydrates, 2 fruit & vegetables – for any meal |
SSB, sugar sweetened beverage; Fe, iron; Na, sodium; Zn, zinc; E, energy; SFA, saturated fatty acids; NMES, non-milk extrinsic sugar; Ca, calcium; NSP, non-starch polysaccharides; Cu, copper; Mg, magnesium; I, iodine
Table 4. Results of quality assessment of studies using the EPHPP Quality Assessment Tool for Quantitative Studies
| Article | Selection Bias | Study Design | Confounders | Blinding | Data Collection | Withdrawals | Global Rating |
|---|---|---|---|---|---|---|---|
| Evans CE et al (2010) | Weak | Strong | Strong | Weak | Weak | Strong | Weak |
| Evans CEL et al (2010) | Weak | Strong | Strong | Moderate | Weak | Moderate | Weak |
| Evans et al (2016) | Moderate | Moderate | Strong | Weak | Strong | Strong | Moderate |
| Evans et al (2017) | Moderate | Strong | Weak | Weak | Weak | Weak | Weak |
| Evans et al (2020) | Weak | Weak | Strong | Weak | Strong | N/A | Weak |
| Huang et al (2017) | Weak | Weak | Weak | Weak | Strong | Weak | Weak |
| Ibeanu et al (2017) | Weak | Weak | Weak | Weak | Strong | Weak | Weak |
| Rogers et al (2007) | Moderate | Moderate | Weak | Strong | Weak | Weak | Weak |
| Stevens et al (2011) | Weak | Weak | Weak | Weak | Weak | Weak | Weak |
EPHPP, Effective Public Health Practice Project
Strong – no weak ratings
Moderate – one weak rating
Weak – two or more weak ratings
Discussion
This systematic literature review has revealed that food consumed at school was either in the form of a school prepared cooked meal eaten in the cafeteria or packed lunches brought from home by the children, with only a small number of studies in 5–8-year-old children of the age group and none in Australia. All the studies in this review indicate that younger primary school children are not consuming the recommended food groups and nutrients during school lunch, whether they are prepared by the school or packed lunches. Guidelines exist for school prepared lunches (e.g. Nutrient and food standards – UK School Food Trust, Nigerian Dietary Guidelines and Chinese Dietary Guidelines) but not for packed lunches. Unfortunately, having guidelines does not seem to ensure that children are meeting the recommended food and nutrient intakes each day.
School prepared lunches
School prepared lunches included hot meals consisting of vegetables, pasta, stew, hot chips and pies. Standards are set for school meals in the UK School Food Trust (2007) and even though school meals have guidelines to follow, children were not meeting the recommended food requirements, nor the nutrient standards (Rogers et al, 2007; Stevens and Nelson, 2011; Evans et al, 2016; Huang et al, 2017). Folate, iron and vitamins were consistently low with sodium, energy from SFA and carbohydrates above the recommended daily intakes (Rogers et al, 2007; Stevens and Nelson, 2011; Huang et al, 2017). Protein was the only nutrient regularly being met by most of the children except for one study by Evans et al (2016), in which protein recommendations were not met. In a study by Huang et al (2017) an analysis of plate waste indicated that the majority of waste was vegetables and fresh fruit with the unhealthier food like flavoured sweetened milk beverages and high-fat food (such as hot chips) consumed more frequently.
Packed lunches
None of the studies mentioned official guidelines for packed lunches brought to school by children. The studies indicated that packed lunches consisted of white bread, processed meat, discretionary foods and minimal fruit and vegetables (Rogers et al, 2007; Evans CE et al, 2010; Evans CEL et al, 2010; Stevens and Nelson, 2011; Evans et al, 2016; Evans and Cade, 2017; Ibeanu et al, 2017; Evans et al, 2020). Even when fruit was packed in the lunch, this was the food that was left at the end of the meal time (Evans CE et al, 2010). When available, the food mostly consumed in the lunch was confectionery (Evans CE et al, 2010). These findings are similar to those supported in a study of older primary school children (up to 11 years) who were not meeting the required serves of fruit and vegetables and overconsumed fat, sugar and sodium (Dresler-Hawke et al, 2009). Protein, carbohydrates and vitamin C in general were the only RDI guidelines being met (Rogers et al, 2007; Evans CE et al, 2010; Evans CEL et al, 2010; Stevens and Nelson, 2011; Ibeanu et al, 2017; Evans et al, 2020). Children with packed lunches were also consuming an average of 3 serves of discretionary foods per day. Most packed lunches consisted of poor quality, energy-dense foods (Dresler-Hawke et al, 2009).
School prepared lunches compared to packed lunches
When comparing school prepared lunches with packed lunches, packed lunches appeared to be higher in carbohydrates, sugar, fat, saturated fatty acids (SFA) and sodium, and lower in protein, fibre, zinc and folate than school prepared lunches (Rogers et al, 2007; Stevens and Nelson, 2011; Evans et al, 2016). The higher carbohydrate and sodium in packed lunches could be the result of the sandwiches made up of processed meat and bread (Rogers et al, 2007; Evans CE et al, 2010; Stevens and Nelson, 2011; Evans and Cade, 2017; Evans et al, 2020). Packed lunches did contain more fresh fruit, fruit juice, salad, water and dairy than prepared school lunches (Evans et al, 2016). Prepared school lunches consisted of more vegetables than fruit when compared to packed lunches (Evans et al, 2016). Rogers et al (2007) conducted a study in South West England and found that protein and vitamin C were the only dietary requirements met for both school prepared lunches and packed lunches. Six of the studies showed that sodium intake in both school prepared and home packed lunches were above the recommended guidelines for children of this age group with home packed lunches faring worse than the prepared school lunches (Rogers et al, 2007; Evans CE et al, 2010; Evans CEL et al, 2010; Stevens and Nelson, 2011; Evans et al, 2016; Evans and Cade, 2017; Evans et al, 2020). The recommended two fruit and vegetable serves were not being met in either meal type (Rogers et al, 2007). Folate, fibre, vitamin A, iron and zinc were lacking in most school prepared and packed lunches.
One of the reasons that children's packed school lunches did not comply with the RDI guidelines could be due to the fact that there are no current guidelines to advise parents regarding recommended packed lunch contents. Furthermore, some parents may not feel appropriately educated to teach their children about nutrition (NSW Government, 2019). Additionally, the amount of nutrition education at schools is very limited (NSW Government, 2019) indicating that teachers may not be adequately prepared to provide sound educational advice about nutrition (Falkenbach et al, 2018; De Vlieger et al, 2020).
Limitations
When considering the limitations of the study, while every effort was made to include all studies of this kind in school settings, some may have been excluded due to the search strategy applied and that only English articles were considered. Due to the heterogeneity of the studies, a meta-analysis was not possible. Food sharing at meal times was not recorded and may also have impacted on the accuracy of what the children were eating of their own lunch.
Recommendations
Given the lack and type of studies in this research area and the potential long-term impact of poor dietary habits, more rigorous research is warranted. In order to instil healthy behaviours with the potential for more lasting effect, it is essential to intervene early in children's schooling life (Donaldson-Pressman, 2014), prompting a need for a greater understanding of the food groups and nutrients that are being consumed by younger children (5–8 years old). It will inform future interventions and provide baseline knowledge regarding children's over- or underconsumption of certain food groups and nutrients. Various types of fruit and vegetable programmes have been trialled in schools in New Zealand, Norway, United Kingdom, United States and Australia with successful results (National Health Service, 2002; Bere et al, 2005; Sally Boyd and Corter, 2007; United Fresh Start Foundation, 2020; Healthy Kids Association, nd-b; 2020). Maintaining these programmes is a problem, as they are expected to decrease over time (Cockburn, 2004; Rohrbach et al, 2006). The need for translational research is imperative to ensure the longevity of positive changes in intervention outcomes.
Websites on healthy eating and physical activity are freely available. They provide parents and teachers with strategies to incorporate these topics into the curriculum, which may contribute to improving eating habits of young children as well as older children (Healthy Kids Association, nd-c; 2020). It has been found that older children waste less of their food, which indicates that it is important that younger children are educated more on the importance and health benefits of nutrients and food waste implications (Niaki et al, 2017). Creating official guidelines to lunchbox content similar to the Healthy Canteen policy created in Australia could be another way of increasing healthy eating in children at school (Healthy Kids Association, nd-a; 2020). The healthy lunchbox policy would help inform parents on which foods are healthy and may help improve the quality of the lunchbox content.
Conclusion
A gap in the literature is evident due to the small number of published studies in this research area. Current research indicates there are long-term health implications for children due to poor dietary habits, hence further research is necessary to fully understand the consumption of foods, the required food groups and nutrients that 5–8 year-olds need to prevent becoming overweight or obese. The majority of studies reported that sodium, energy from fat and SFA were above the recommended guidelines with folate and iron below the recommended guidelines, suggesting that more nutrition awareness is needed in schools and at home. Studies conducted with older primary school children show that the consumption of food groups and nutrients does not improve with age and they also are not meeting the guidelines (Sanigorski et al, 2005; Moffat and Galloway, 2008; Rees et al, 2008). By determining the consumption of the different food groups and nutrients by the younger age group, and intervening at this younger age, eating habits could possibly be improved as they get older.